What Is Divergence Radar
Divergence Radar is a real-time market scanner that automatically detects divergences between price and technical indicators — RSI or MACD. Instead of manually flipping through hundreds of charts looking for that one setup, the radar does the heavy lifting for you and surfaces the most interesting opportunities on a single screen.

A divergence happens when price moves in one direction but the indicator moves in the opposite direction. For example, price makes a higher high, but RSI makes a lower high. That mismatch is one of the most reliable early signals that a trend is losing steam and a reversal could be coming. Divergences are the kind of setup that seasoned traders spend hours hunting for — Divergence Radar finds them in seconds.
Choosing Your Indicator: RSI vs. MACD
The radar supports two indicator modes. Toggle between them at the top of the screen:

- RSI Divergence — compares price swings with Relative Strength Index swings. RSI divergences are particularly effective at spotting exhaustion after extended moves.
- MACD Divergence — compares price swings with MACD histogram peaks. MACD divergences tend to capture broader momentum shifts and work well on higher timeframes.
Both modes scan the same set of pairs and use the same filtering system, so you can switch between them freely depending on your trading style.
Filters: Zeroing In on What Matters
The filter bar lets you narrow down results so you only see setups that match your criteria.

Timeframe
Choose from five timeframes: 15m, 30m, 1h, 4h, or 1d. Shorter timeframes produce more signals but with more noise. Higher timeframes produce fewer, more reliable signals. Many traders check multiple timeframes — a divergence that appears on both 1h and 4h is significantly stronger than one that only appears on 15m.
Divergence Type
Filter by direction:
- Bullish — price makes a lower low while the indicator makes a higher low. Suggests downside is fading, potential long opportunity.
- Bearish — price makes a higher high while the indicator makes a lower high. Suggests upside is fading, potential short or take-profit zone.
- Bullish / Bearish — show both types.
- No filter — show everything, including pairs with no active divergence.
Min. Score
Every detected divergence receives a quality score from 1 to 3 based on factors like volume confirmation, CVD alignment, and the sharpness of the indicator swing. Set the minimum score to filter out weak signals:
| Score | Meaning |
|---|---|
| 1+ | All signals, including weak ones |
| 2+ | Moderate confidence — volume or CVD confirmed |
| 3 | Strong signal — multiple confirmations aligned |
Min. Volume
Filter out low-volume pairs. If you only want to trade liquid assets, set a minimum 24h volume threshold to hide illiquid tokens that are prone to manipulation.
Sort By
Control the order of results:
- By volume — highest-volume pairs first (default, best for finding the most tradable setups).
- By score — strongest divergences first.
- By RSI Δ / MACD Δ — largest indicator change first, which highlights the most dramatic divergences.
Understanding the Watchlist Cards
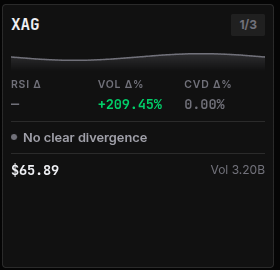
Each pair appears as a card on the watchlist. Here is what you see on a typical card:

The card displays:
- Symbol (top-left) — the trading pair, e.g. CRV or XAG.
- Badge (top-right) — shows the divergence type if one is detected, such as Bull or Bear, or a counter like 1/3.
- RSI Δ / MACD Δ — the difference in indicator value between the two swing points. A larger delta means a more pronounced divergence.
- VOL Δ% — change in trading volume between the two swings. Rising volume adds conviction.
- CVD Δ% — change in Cumulative Volume Delta. This shows whether buyers or sellers were more aggressive.
- Price and Volume — current last price and 24h volume for context.
When a divergence is detected, the card transforms to show the key details:
Notice the Bear badge, the specific price and RSI levels of the two swings, the number of bars between them, and the divergence verdict. All the information you need to make a decision — right on the card.
Diving Deeper: The Detail Modal
Click any card to open the detail view. This is where the magic happens.

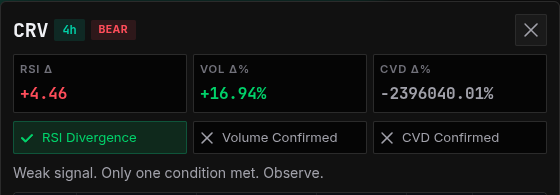
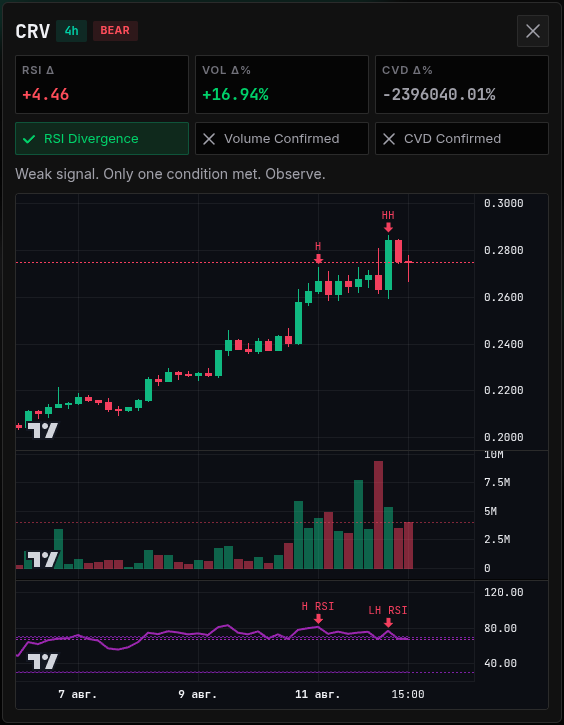
The header shows the symbol, timeframe, divergence direction, and the three key metrics: RSI Δ, volume change, and CVD change. Below that, you will find confirmation badges:
- Volume Confirmed — trading volume supports the divergence signal.
- CVD Confirmed — order flow (buyers vs. sellers aggression) aligns with the expected reversal direction.
- A textual assessment — for example, "Weak signal. Only one condition met. Observe." or "Strong signal" when multiple confirmations align.
The Chart
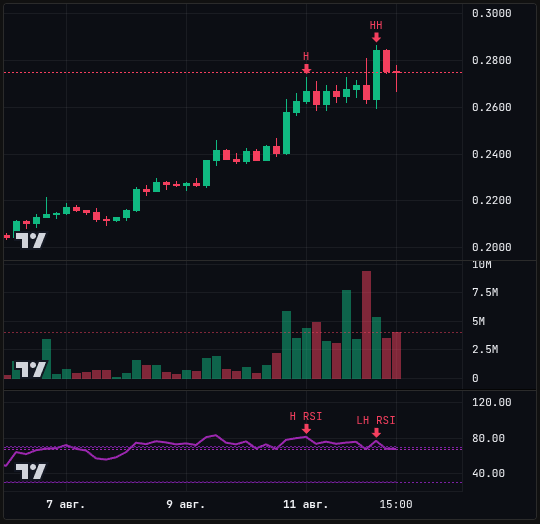
Below the summary, the chart displays the price action with the divergence markers clearly drawn:
The chart highlights both swing points connected by trend lines — one for price, one for the indicator — making the divergence visually obvious. You can see the price trend line and the indicator trend line diverging from each other, which is exactly the pattern the radar detected algorithmically.
Full Modal View
Here is what the complete modal looks like when you open it:
Signal Sections: Strong, Forming, and Watchlist
The radar organizes results into three sections so you can prioritize at a glance:
- Strong signal — divergences with a score of 3, confirmed by both volume and CVD. These are the highest-probability setups.
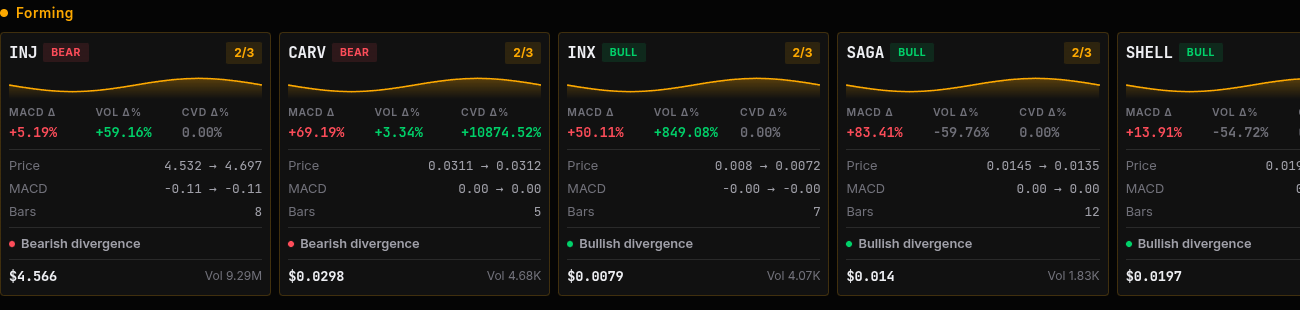
- Forming — divergences that are still developing. The pattern is not yet complete, but the early signs are there. Watch these closely.
- Watchlist — all tracked pairs, including those with no current divergence. Useful for monitoring overall market health.
When you switch to MACD Divergence mode, the Forming section becomes particularly valuable because MACD divergences often take longer to confirm:
CVD: What Is Cumulative Volume Delta?
One of the features that sets Divergence Radar apart is its use of CVD (Cumulative Volume Delta) as a confirmation factor. CVD tracks the difference between aggressive buy orders (taker buys) and aggressive sell orders (taker sells) over time.
When a bearish divergence is accompanied by a negative CVD delta — meaning sellers were more aggressive during the price rally — that strengthens the reversal signal. Conversely, a bullish divergence paired with positive CVD delta (buyers stepping in on the dip) is more convincing than one without.
The radar pulls real taker buy/sell data directly from Bybit's WebSocket feed, so the CVD numbers reflect actual market aggression, not estimates.
How to Use Divergence Radar: A Practical Workflow
Step 1: Pick Your Indicator and Timeframe
Start with RSI Divergence on the 4h timeframe. This combination offers a good balance between signal frequency and reliability. You can always switch to MACD or adjust the timeframe later.
Step 2: Filter for Quality
Set Min. Score to 2+ to filter out weak signals. If you only trade liquid assets, set a Min. Volume threshold appropriate for your exchange tier.
Step 3: Scan the Strong Signal Section First
If there are any cards in the Strong signal section, those are your top candidates. Open each one, review the chart, and check whether the confirmation badges (Volume Confirmed, CVD Confirmed) are green.
Step 4: Check the Forming Section
Forming divergences are early warnings. Add these pairs to your personal watchlist and check back in a few candles to see if the pattern confirms.
Step 5: Confirm Before You Act
Divergence Radar tells you where to look — it does not tell you when to enter. Once you find an interesting setup, confirm it with additional analysis:
- Check RSI Heatmap to see if the asset is in an extreme zone.
- Look for TA Patterns like Head & Shoulders or Double Top that might reinforce the reversal.
- Monitor Pump & Dump Detector for signs of aggressive price manipulation.
Real-Time Updates
The radar updates automatically every time a candle closes. At the bottom of the screen, you can see the scan status:
This line tells you exactly how many pairs were scanned, when the data was last updated, and that the next refresh will happen on the next candle close. No need to refresh the page — the radar keeps working in the background.
Common Questions
Is every divergence a guaranteed reversal?
No. Divergences are a warning sign, not a guarantee. They work best as a confluence factor — combine them with support/resistance levels, chart patterns, and volume analysis for higher-probability trades.
Which timeframe is best?
It depends on your trading style. Scalpers may prefer 15m, while swing traders typically use 1h–4h. The daily (1d) timeframe produces the most reliable signals but they appear less frequently.
What does the score mean?
The score (1–3) reflects how many confirmation factors are aligned. A score of 3 means volume, CVD, and indicator sharpness all agree — the strongest possible signal the radar can generate.
Final Thoughts
Divergence Radar is built to save you time. Instead of spending your day opening chart after chart looking for that textbook divergence setup, the radar scans the entire market for you in real time and ranks opportunities by quality. The combination of RSI/MACD analysis with volume and CVD confirmation gives you a powerful edge in spotting reversals before they become obvious to everyone else.
Pair it with RSI Heatmap to find extreme zones, TA Patterns to identify classic chart setups, and the Pump & Dump Detector to catch aggressive moves — and you have a complete toolkit for navigating the crypto market with confidence.
Comments